This article explains how to navigate the Reporting tab, adjust date ranges, customize dashboards, and understand the available graphs.
Accessing the Reporting Tab
-
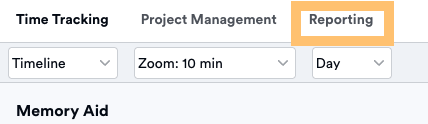
Open Memtime and navigate to the Reporting tab.
-
Select a date range by clicking on the date displayed in the top-left corner of the Reporting tab.
You can:
-
Choose a predefined date range (such as This Week or Last Month) from the left panel, or
-
Set a custom date range using the right panel.
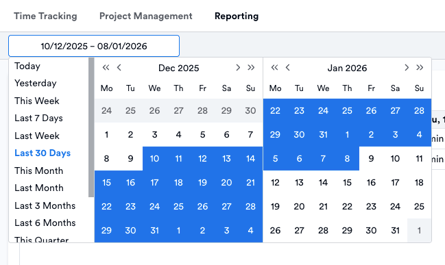
The selected date range applies to all graphs and dashboards shown in the Reporting tab.
Customizable Dashboards
Dashboards in the Reporting tab are fully customizable, allowing you to adapt them to your workflow and reporting needs.
Key features:
-
You can create multiple dashboards, each tailored to a specific use case (for example: productivity overview, client reporting, or internal analysis).
-
Each graph acts as a widget within the dashboard.
-
Widgets can be:
-
Moved freely across the dashboard
-
Resized to emphasize the most relevant data
-
Rearranged to create a layout that suits your preferences
-
This flexibility allows you to build dashboards that highlight the insights that matter most to you. Here's a video with an example:
Available Graphs in the Reporting Tab
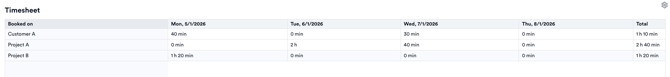
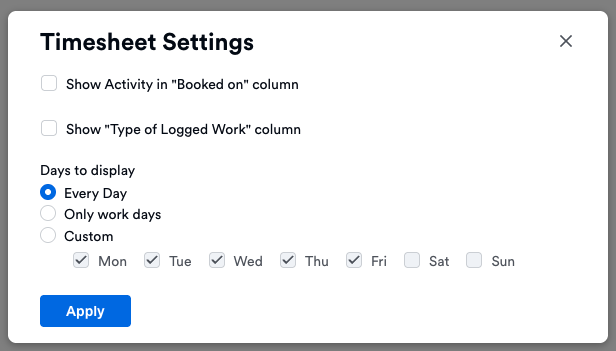
1. Timesheet Graph
The Timesheet graph provides a structured overview of your time entries.
You can change the settings of your Timesheet graph by clicking the settings button:
To learn more about creating and exporting Timesheet data, click here.
2. Productivity Graph
The Productivity graph compares:
-
The total time spent on your device (all tracked activities)
-
The time booked to projects
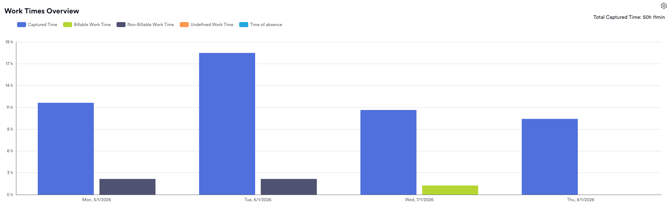
This graph helps you understand how much of your tracked activity time is allocated to projects and clients.
3. Project Times Graph
The Project Times graph shows a breakdown of time allocated to:
-
Projects
-
Clients
-
Tasks
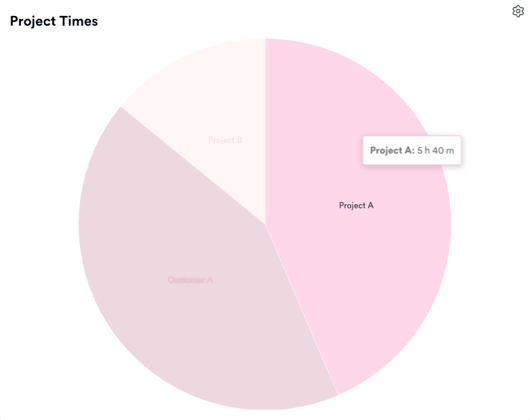
This is useful for analyzing how your time is distributed across different work areas.
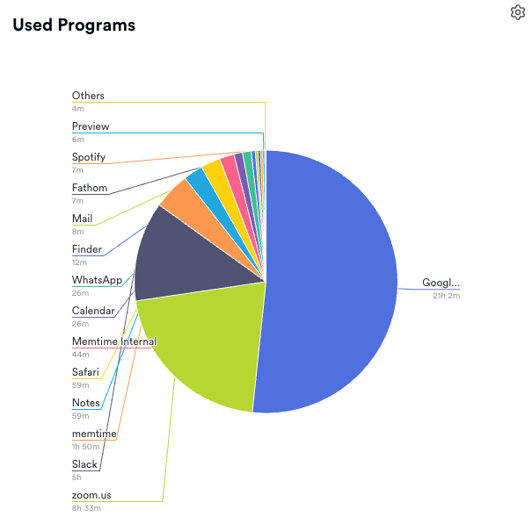
4. User Programs Graph
The User Programs graph provides an overview of:
-
The applications you use most
-
The total time spent in each app
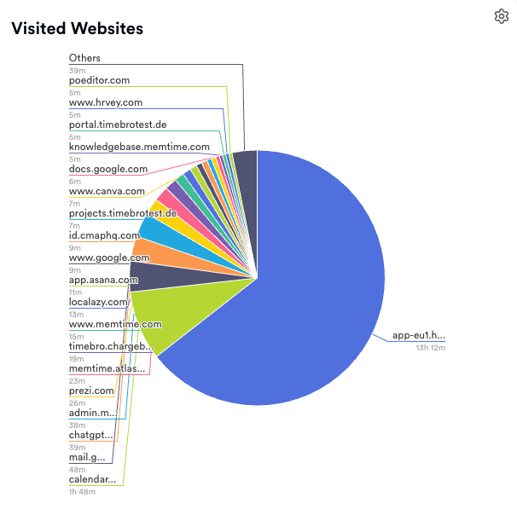
5. Visited Websites Graph
The Visited Websites graph shows:
-
The websites you visit most frequently
-
The amount of time spent on each website